Microsoft Power BI can help you find the needle in your haystack. What do I mean by this? What if you see a sudden spike or a sudden decline in sales for a particular product or service for a particular month and you have no idea what caused it? You would certainly like to know what caused the increase in sales so you could repeat it. You would also like to know how to avoid the next decline.
The Search for the Needle
Microsoft Power BI is a tool that helps you to discover insights hidden in your data.
Here is an example from Microsoft’s “Dashboard in a Day” training curriculum content that should give you an idea of what is possible.
Moving to the “By Manufacturer” report page, you look at the “Revenue by Country” visual for the same period. You see that the “Urban” product category is 99% of the revenue for that period but if you look at other countries, you see that is about the same for those countries also.
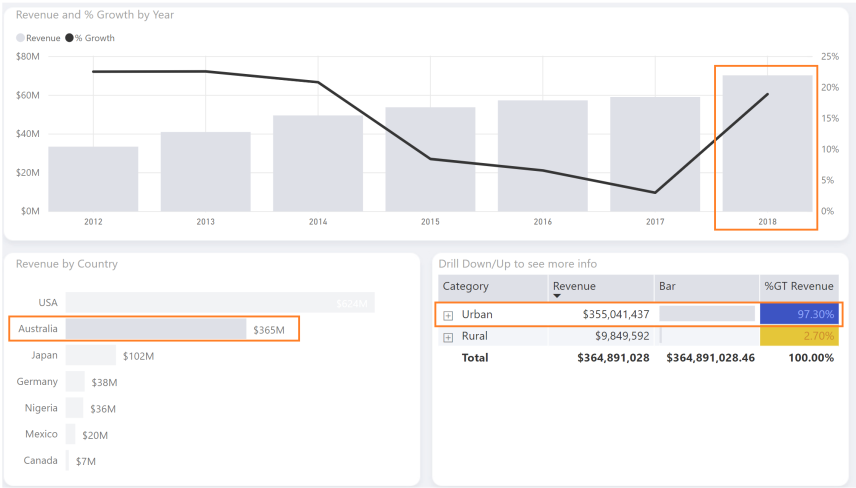
If you drill into the “Urban” category to investigate however, you see that there is an unusual spike in the sales for the “Extreme” product segment for the period.
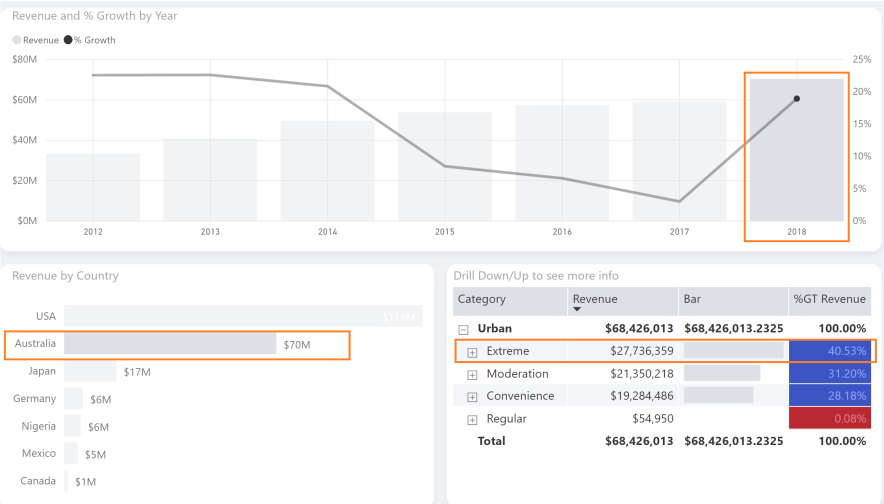
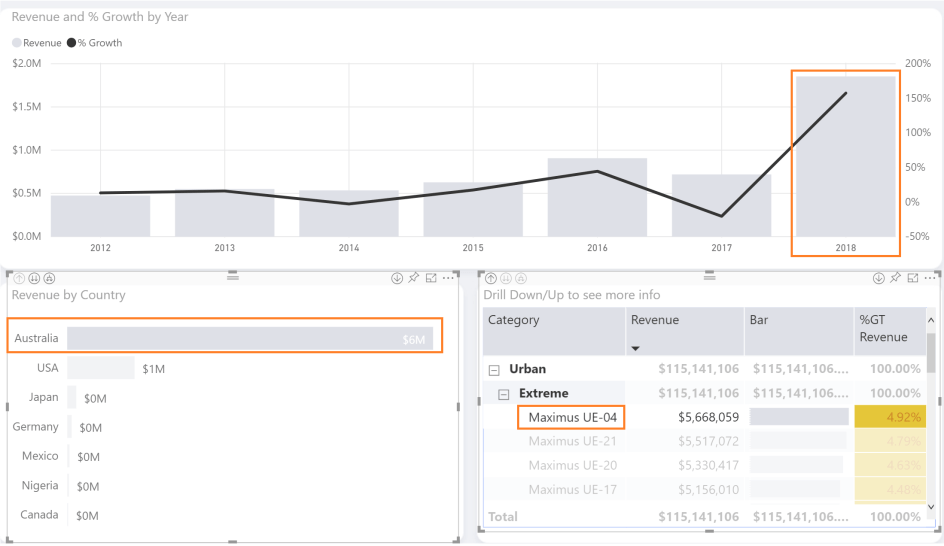
If you drill into the “Extreme” category, you also see the same spike in the Top 5 products for the period, including the “Maximus UE-04” product.
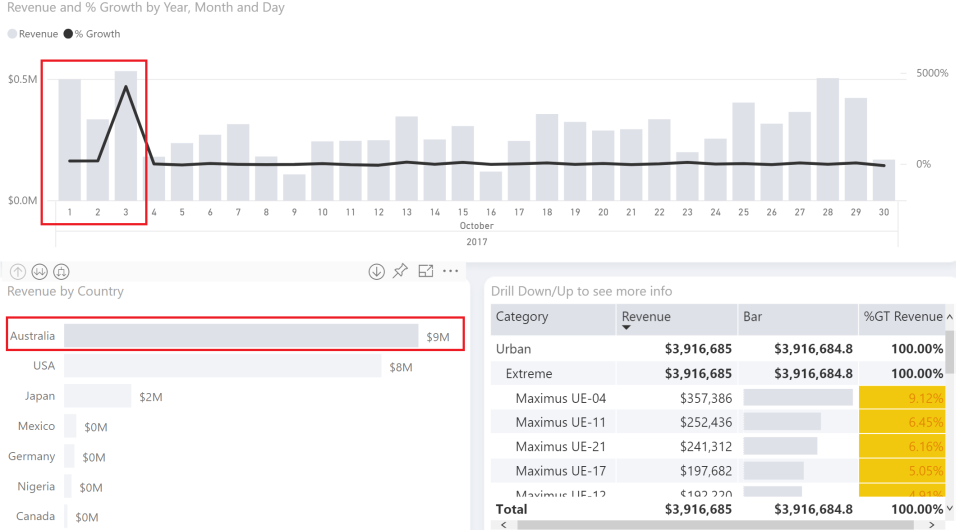
Drilling into the “Revenue and % Growth by Year” visual, you can see that there is a spike in the last few days of September and the first few days of October for the “Maximus UE-04” product. At this point, you know that something unusual happened around the end of September, beginning of October period.
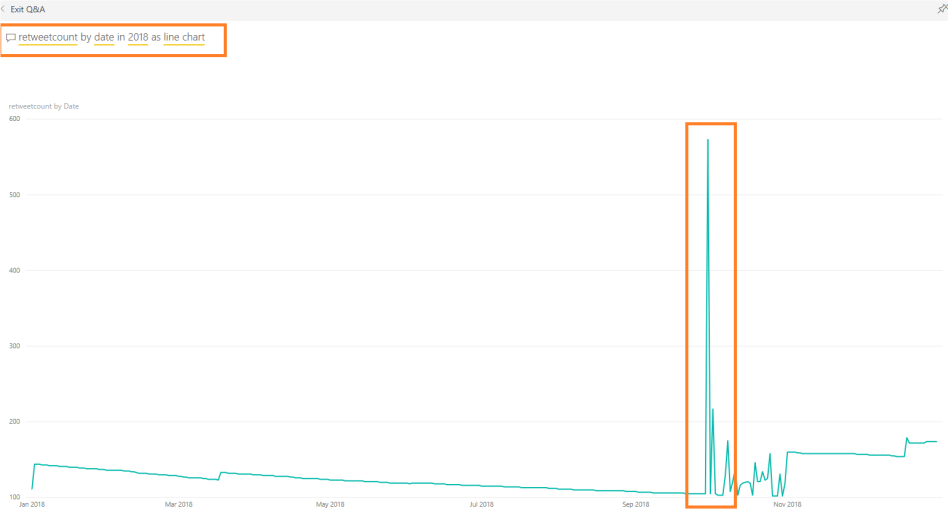
You have captured Twitter data for your company and added it as part of this report’s data model. Using the built-in “QnA” capabilities in Power BI, you see that there is a definite spike in retweets during this same period.
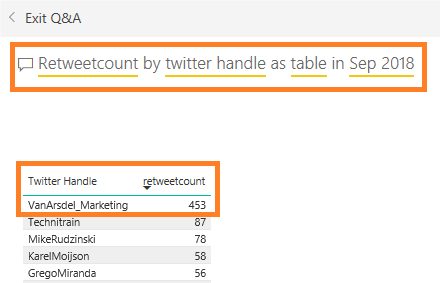
Looking at the Twitter data by handle for this period, using the “QnA” feature, you see that a Twitter initiative by the marketing department lead to the spike in sales!
Summary
Weidenhammer offers Microsoft’s Power BI “Dashboard in a Day” training curriculum as a service to customers. This is a one-day introductory training aimed at Business Analysts. It consists mostly of hands-on labs along with some added context information and answers to any questions that might come up during the training. This training has been traditionally offered in-house or in a classroom setting, but due to the current COVID-19 circumstances, Microsoft is revamping the curriculum so that it now can also be offered remotely.
Microsoft’s Power BI product is a Gartner ® Magic Quadrant Leader in Analytics & BI Platforms for 2020.

Click here to learn how Weidenhammer can help you with your Data Analysis Needs.
Resources: Microsoft Power BI “Dashboard in a day” training materials. For more information go to https://powerbi.microsoft.com/en-us/